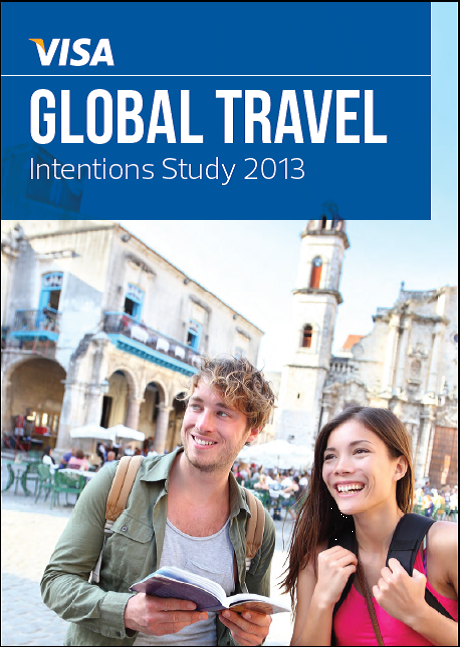
Global Travel Behavior Trends 2013

Visa‘s latest Global Travel Intentions Study 2013 has revealed that global cross-border tourism is thriving and travelers intend to increase budgets for their next trip by an average of 5% – with some holidaymakers even suggesting that they would more than double what they spent on their previous trip.

Visa’s regular barometer of travel trends indicates budgets are no longer among the top three reasons behind why travelers choose their next holiday destination. The pull of attractions, scenery and rich culture are instead stronger reasons for travel.

Global-Travel-Intensions-Study-20131

According to the Study, which surveyed 12,631 travelers from 25 countries, the average global travel budget of US$2,390 per trip is set to increase to US$2,501. Top spenders abroad in the past were the Saudi Arabians, spending an average of US$6,666 per trip, while Australian (US$4,118) and Chinese travelers (US$3,824) were not far behind. Future travel budget increases are especially high amongst Asian markets with a predicted increase of 46 percent – travelers from Singapore, Thailand and Hong Kong all plan to at least double the budget of their last trip in the future.

United States remains the top choice destination

Attractions, Scenery, and Culture were cited as the key drivers for a future trip regardless of destination. This desire to explore new horizons was evidenced by the latest UNWTO World Tourism Barometer, which revealed that international tourist arrivals grew by four percent in 2012 to reach 1.035 billion.

Visa’s Study revealed the United States ranked as the most popular destination choice for global travelers, both for trips taken in the past two years (17 percent) and for intended travel in 2013 (10 percent).

Other top destinations in 2011 and 2012 included the United Kingdom (UK) (12 percent), France (12 percent) and China, Singapore, Thailand and Hong Kong (all 10 percent). Looking ahead, regional travel is set to increase, especially in reflection of the growing popularity and economic strength of Asia Pacific (APAC). 31 percent of global travel is expected to be to Asia, and new APAC destinations such as Australia (four percent) and Korea (three percent) are making it on to the latest list of most preferred destinations for future travel.

Travelers also ranked Japan (five percent) and Australia (four percent) alongside the UK (five percent) as the top four intended destinations for future trips abroad.

The Rise of the Asian Giant

The increasing popularity of APAC is partially driven from within the region. Among travelers across the four global regions (APAC; the Americas; Middle East and Africa; Europe), respondents from APAC indicated strong intention (77 percent) to travel more in the future – with residents from nine of the region’s markets stating a higher intention to travel than the global average. Much of this increased travel is expected to take place within the region, where 80 percent of Asian travelers have chosen to take trips in the last two years.

APAC travelers are also spending more during their trip – those traveling within the region spent an average of US$273 per day, higher than both the global average (US$239) and any other region.

“The Asian markets have experienced a huge boom in tourism over the past few years due to the continued strength of their economies and the implementation of policies that promote cooperation and coordination in cross-border tourism. The ease of travel within the region, coupled with a rising middle class, has seen a growing demand for travel among the population and we expect this trend to continue into 2013 and beyond,” said Martin Craigs, Chief Executive Officer, Pacific Asia Travel Association (PATA).

Increasing Ease of Travel

An increasing ease and availability of travel options is fuelling the tourism boom. This is particularly prominent in the airline industry where 85 percent of travelers prefer to fly to their destinations despite a preference for shorter distances. Of this figure, most (71 percent) chose to fly economy class while, perhaps surprisingly, only 16 percent chose budget airlines.

A Profile of Today’s Global Traveler

The results of the study paint a picture of today’s global traveler. They are seasoned travelers, with 79 percent travelling in the past two years, taking 1-2 trips per year. 80 percent plan their holidays in advance, taking an average of 10 weeks to organize the trip. Spending time with family and friends was cited as the most popular (38 percent) reason for a holiday. These trips are more likely to be organized independently (42 percent) and will last an average of 10 nights. They choose hotels of four stars and above (39 percent) with 69 percent choosing to take a trip with family members.

More: corporate.visa.com

Global competitive survey: 3% of international tourists complaining with visa formalities

Global benchmarking survey TRAVELSAT© estimates that 3% of international tourists (*) have been in a situation to
complain following to a negative experience with their visa formalities.

TCI Research CEO Olivier Henry-Biabaud comments: “Living a negative experience with visa formalities directly impacts the tourists’ safety feeling seen a key driver of destinations’ quality competitiveness today. It also shapes destinations’ reputation and possibly stops potential visitors to travel if too restrictive or raising complaints. Provisional data also tend to show huge disparities according to markets and destinations. However reviewing the whole destination quality performances, the percentage of visa related complaints remains relatively limited compared to other areas such as the accommodation which generates over 10% of negative experiences in average.”

(*) Technical note: provisional estimate based on 3000+ past 6 month international visitors from the top 20 largest outbound markets.

About TRAVELSAT Competitive Index©:
TRAVELSAT© is the UNWTO Award winning reference, global and independent survey benchmarking international tourists’ experience and satisfaction in a standard way for all destinations. It monitors 80+ Quality Indexes for over 200 worldwide countries, markets and segments, based on representative opinion of tourists who experienced the destination. TRAVELSAT© provides an innovative instrument for destinations willing to improve their competitiveness, management and marketing in a global and complex international competitive environment. TRAVELSAT© data
are collected, controlled and provided by TCI Research, an independent research agency dedicated to survey-based tourism competitive intelligence.

More information on www.tci-research.com.
Contact:
Olivier Henry-Biabaud
TCI Research Ldt
18 rue Mareyde – 1150 Brussels (Belgium)
+32 476 70 11 25 olivier.henry-biabaud@tci-research.com

Study Snapshot: Key Market Travel Spending Trends 2012

Global travel spending is on the rise, building momentum toward pre-recession levels, according to Visa’s 2011 Travel Snapshot.

The recently released report highlights key spend insights from its account holders traveling to and from the United StatesCanadaMexico and Brazil. Travelers from the United States increased tourism spend by 7 percent, those from Canada by 11 percent, and Mexico by 19 percent. Most notably, travelers from Brazil increased international travel spend on their Visa accounts by 32 percent in 2011 – 43 percent of which was in the United States.

Brazil proves to be a formidable contributor to the global tourism economy, increasing outbound spend by 32 percent.

Key Markets Spending Trends

Brazil: While the United States remains the top destination of choice for Visa account holders from Brazil, most European nations recognized double digit increases in travel spend by Brazilian Visa account holders in 2011. Spending by Brazilian Visa account holders increased by 30 percent in France, 44 percent in Italy and 41 percent in the United Kingdom.

United States: Brazil and China proved to be significant corridors for travel to the United States. Visa account holders from Brazil increased spend on travel to the United States by 41 percent, from $1.9 billion in 2010 to $2.7 billion in 2011, edging out the U.K. as the second highest total contributor to U.S. tourism revenue. Account holders from China increased travel spend within the United States by 61 percent, from $741 million in 2010 to $942 million in 2011. Similarly, account holders from the United States increased travel spend in China by 27 percent, from $741 million in 2010 to $941 million in 2011.

Canada: While Visa account holders from the United States ($3.5 billion), France ($351 million) and the United Kingdom ($348 million) remained the top three contributors to Canadian tourism, Visa account holders from China had one of the most significant increases with a 41 percent increase year over year, from $229 million in 2010 to $321 million in 2011.

Mexico: Visa account holders increased spending in Mexico by six percent in 2011. While Russian account holders increased travel spending in Mexico by 73 percent, travelers from South America also showed more interest in Mexico with Argentina (+58 percent), Brazil (+56 percent), Peru (+30 percent) and Colombia (+30 percent) following Russia with the greatest increases in travel spend to Mexico in 2011.

Sourcecorporate.visa.com

Lasting Tourism Effects of Mega-Sport Events

Visa Inc. has released a new report that shows the effects of mega-sporting events and the impact they have on tourism spending in the event host countries.

The report analyzes Visa cardholder spending patterns of three recent mega-events: 2010 FIFA World Cup South Africa(TM), the Vancouver 2010 Olympic Winter Games and the Beijing 2008 Olympics Games. According to the report, events of this scale create significant increases in expenditure and give host countries a chance to shine on the global stage.

For each of the three events analyzed, there was healthy growth in Visa payment card expenditure during the event compared to the year prior:

  • 82 percent for the 2010 FIFA World Cup South Africa(TM)
  • 93 percent for the Vancouver 2010 Olympi Winter Games
  • 15 percent for the Beijing 2008 Olympic Games

“These three events have been catalysts of economic recovery for the host country and nations surrounding it in terms of international tourism spending. Electronic payments play a crucial role in facilitating this sustainable tourism growth. They ease the difficulties travelers face when making purchases in other countries,” said Antonio Lucio, Visa’s chief marketing officer.

Olympic Games

One of the key factors for any Olympic host city and country is the legacy that is left behind. It is critical for countries to be in a position to leverage the global attention events like the Olympic Games can generate, as well as maximize investments made in preparation for the influx of inbound travelers.

  • In Beijing, visitors from the U.S., Hong Kong, the United Kingdom, South Korea and Japan accounted for more than half of all Visa card spend in China from Aug. 8 – 25, 2008. During that period, there were approximately 840,000 Visa transactions with an average daily spend of $10.6 million from international cardholders.[1]
  • Vancouver experienced double digit growth in the total tourism spending by inbound Visa cardholders during the months of February and March compared to the same time period in 2009. In the heart of the Games, from February 12 – 28, there were approximately 1.14 million Visa transactions, with an average daily spend of $7.2 million from international cardholders.[2]

FIFA World Cup

Daily Visa payment card expenditures made by all non-South Africans while in South Africa during the period from June 1, 2010 until July 31, 2010 were compared to similar data for the same two month period in 2009. As the FIFA World Cup(TM) itself lasted from June 11 to July 11, 2010, the data set provided comparative information for 10 days before and 20 days after the Cup. According to this data, the FIFA World Cup(TM) provided a platform for South Africa to showcase their nation to the world, up-leveling their global status and tourism levels increased throughout the year. While the FIFA World Cup(TM) played a significant role in the growth experienced in June and July, visitor arrivals were amplified all year. Spending levels by international Visa cardholders traveling to South Africa in December ($220M) and January ($200M) even rivaled the June ($222M) and July ($204M) World Cup months.

According to Burke, “What is particularly encouraging is the strong indication that in the mega-sporting events analyzed for this report, tourism-related spending increased substantially during the events and far beyond any increases that can be attributed to economic recovery only”.

For more information and to view the report it its entirety, please visit www.corporate.visa.com.

Check out an older but still relevant AbouTourism post on Mega Events and Destination Development & Marketing.